
GIS Solutions
-

GIS Analysis
GIS is used for a variety of spatial analysis, from raster calculation, mapping acres of land use, to property ownership among many other uses.
-

Cartography
Using a suite of GIS and other data processing programs, custom maps are produced for reports, permits, and other applications.
-

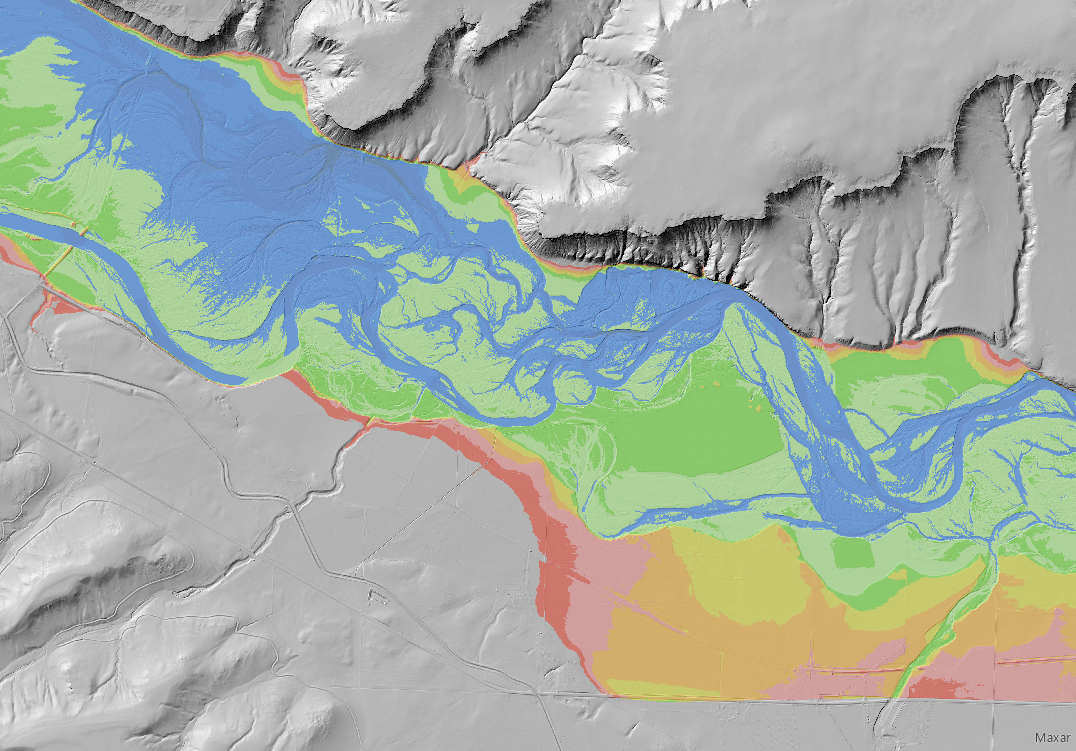
Relative Elevative Models
Using Lidar or photogrammetric point clouds, GIS is used to create relative elevation models, producing an elevation model relative to the stream profile.
Story Map Presentations
-
Brown Trout Redd Mapping
This Story Map outlines a project using the Field Maps application to map brown trout redds along streams. UAS was then used in an attempt to identify redds from orthoimagery and oblique video with varying degrees of success.
-
Characterizing Fluvial Geomorphologic Change Using Unmanned Aerial Systems and NAIP Imagery
This Story Map presentation outlines a study in classifying land cover types with UAS and NAIP Imagery, it then measures and quantifies geomorphic change over multiple years.